2022-03-07
A simple SIR model of Hong Kong’s Omicron outbreak.
Lots of better qualified folks than I have been modeling COVID since the pandemic began. However, now that Omicron has arrived here, I decided that I needed to wrap my mind around the dynamics of the current pandemic. This is mostly for my own sanity, but also because I am teaching and need some indication of the scale and timing of the wave so that I can attempt to adapt my schedule to the needs of the students.
The model.
To model the pandemic I am using the SEIR model from Quant-Econ
The SEIR model is based on a few characteristics of the disease:
- The average duration of illness. I’m using 10 days.
- The average incubation period of the illness. I’m using 3 days.
Both parameters are from the European Centre for Disease Prevention and Control. Assessment of the further spread and potential impact of the SARS-CoV-2 Omicron variant of concern in the EU/EEA.
I’m going to model a Omicron infection seeded on 16 Jan 2022 within Hong Kong’s population of 7.482 million people.
R0 or Rt
While duration and incubation are largely determined by the biology of the virus, the transmission rate depends both on the virus and on the dynamics of the population into which it is introduced. Vaccination rates and social distancing are the key dimensions of the population that I’ll consider. R0 is the transmissibility of the disease on day zero and Rt is the transmissibility on the subsequent days.
I’m going to model four transmissibility scenarios:
- Rt=16 for all t. This is the high end of the U.S. CDC’s estimate of R0 which I’m using as a heuristic for transmissibility is a population with no natural or vaccinated immunity and no social distancing.
- Rt=7 for all t. This is the low end of the U.S. CDC’s estimate.
- Rt=6 from 16 Jan 2022 until 8 Feb 2022, with a 69% reduction thereafter due to social distancing. R_t of 6 is HKU’s estimate of the reduction in transmissibility due to the level of vaccination in the population and the 69% reduction is based on the fact that the current level of social distancing created a 69% reduction in transmission when it was implemented in previous waves. This approach will not capture differences in adherence to social distancing protocols between this wave and previous waves, but has the advantage of being based on actual behavior of the population being modeled (which is an overly pedantic way of saying: us the folks living here right now).
- R_t=6.555 for all t. This is the value that matches the current observed level of confirmed positive cases. While this number is limited by the fact that the test and trace regime is at or above capacity, this is a concrete number we can use for a sanity check on the other estimates. I’ll probably come back and update this, adding new lines to capture how the observed R_t evolves.
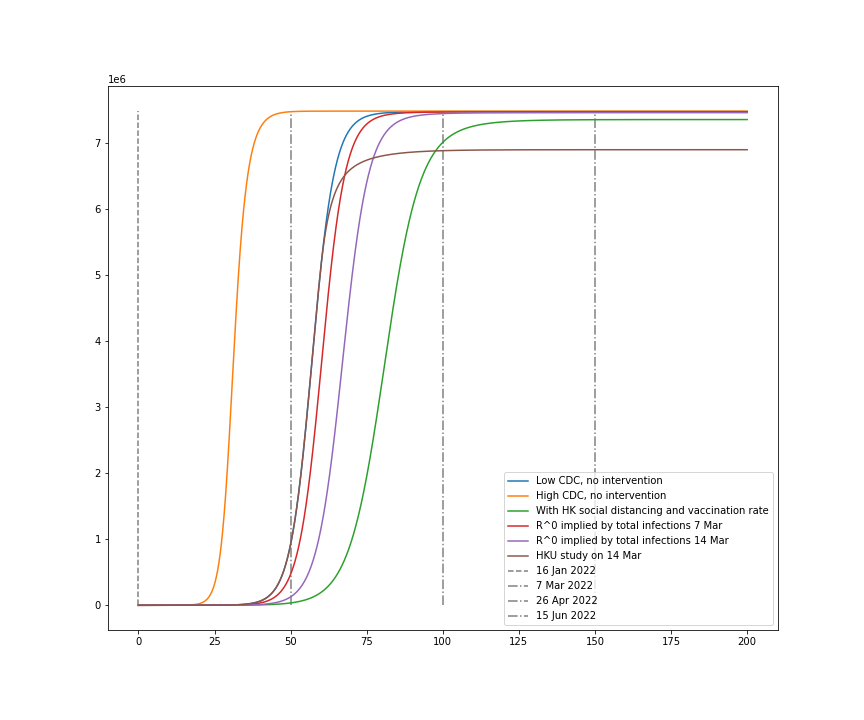
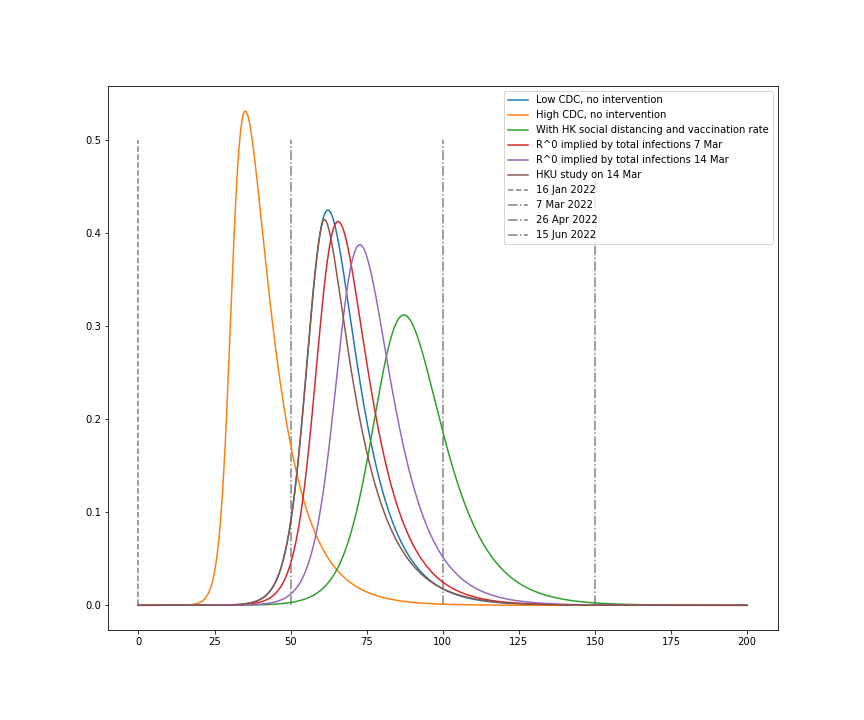
The plots:
Daily Infections
Cumulative Infections